The resulting data
After reading out and plotting the data, this is what I got. Horizontal is the
sample number, vertical is the AD readout which basically corresponds with
a scale from -6G to +6G.
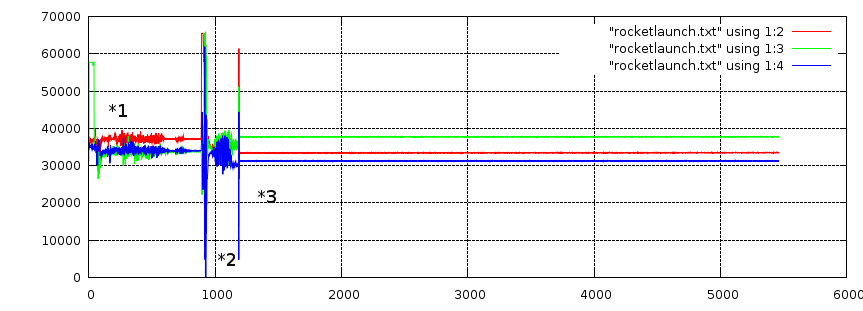
An explanation of what happens: at 1, the rocket is brought to the launching
pad. 2 is the launch, flight and subsequent falldown to earth. 3 is the
nose-cone containing the logger lying still in the mud somewhere, waiting for
us to find it. Only part 2 is really interesting, so let's zoom in on it.
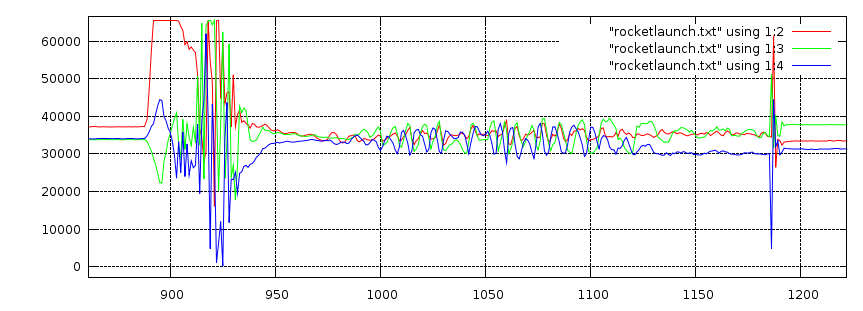
What you can see here is the readout clipping at the 900-samples mark because of
the sheer force at take-off. After that, there seems to be some vibrations,
possibly induced by the airflow, which die out at about 975 samples. Then
the device starts tumbling down to the ground until it finally hits dirt
at 1185 samples.
A quick calibration reveals that the firmware does about 22 samples a second.
This means the rocket took about 3 seconds to reach its apex, while the
process of tumbling down took about 8.5 seconds. While the nose probably
isn't the most aerodynamic thing in the world, we can probably approach the
height it reached by looking at it as a solid, frictionless object falling to
the ground in a time of 8.5 seconds. If my physics knowledge serves me right
(and I do hope it does, it's been a while...) this would mean the rocket
has soared up to a height of 0.5*(8.5sec^2)*9.8=700350 meters (thanks, 'a person'). While the real height
probably is less because the nose-cone would have reached terminal velocity after
a few seconds, it does give a nice indication of the order of
magnitude of height such devices can reach.
If you want to draw your own conclusion from the actual flight data, you can download it here. Offcourse, if you think your estimation of the maximum height is better than mine, feel free to comment.
« Prev 5
19 commentsNice work. I have done the same with MMA7260 and home-made water rockets with bottles (more safe)... The problem is that accelrometer run over the 6G, seems to reach 10G. So have attention on this point when you choose your rocket. Best regards.
The engine that Sprite used was a D7-3 from "Weco". The rocket itself was made from thick paper (250 g/m2), and was designed and built on site.
Actually the people behind the accelerometer do provide free samples. That company happens to be Freescale. And as it happens the next question is, "What company's rocket engines and kits did you use?"
I think that spike around 41 s' could be the charge that launches the parachute. In the rocket engines I have used there was a small charge at the end. At first it would have to blow the top of the rocket engine and the rocket tip off, pressure initially would go downwards causing thrust. The charge is delayed by a small amount to go off after the engine burnt out. I am not an expert, but I do like my rockets. It appears to be quite possible given that the rocket in question had such a charge.
wow patrick, that's great, didn't think it's possible to extract that much info from it. Anyone explain why the acceleration starts increasing again at ~41.5s?
I took a crack at calibrating the data. I used the fact that the net acceleration measured by the three channels should be 9.8 m/s/s to bang out the cal. I also removed a slowly increasing bias from the data. After I got the cal I used the general shape and peak in the acceleration seen in the y and z channels to guess where the peak in the x acceleration was (why not). I put the work up here: http://www.lobsterharmonica.com/stuff/hackaday_rocket_logger/hackaday_rocket.html There's a link on that page to the calibrated data. I'm too lazy to try and turn it into range right now.
the train, true, some fancy ass accelerometers auto-resole and compensate for the gravity vector. They charge the deflected side of the proof mass and use the e-field charge to move the tuning fork tips back into the center positions, so the sensor has the most dynamic range.
I like the cheap Nunchuck too but on the other hand that chip is $3.50 from digikey, granted no brakeout bourd.
Accelerometers work best when they're at the center of mass of the system. All that laterally directed hash at launch is likely due the nose of the rocket coning around.
pretty sure all accelerometers output 1G in the vertically oriented axis when stationary... because the device is still experiencing 1G of accelleration towards the centre of the earth (gravity)! Just a thought: if you orient the sensor at 45deg, you might be able to calculate a better vertical accelleration from the vector sum of two axes before clipping occurs.
Good point, I didn't look at the data close enough to see the saturation. Also something to keep in mind is that Freescale accelerometers always read 1G when stationary as can be seen from the start of the graph where the Z axis lies above the other two. I've only used Freescale's so I'm not sure if this is the norm.
a_person: Thanks, I changed the equation and the link. 350m seems a lot more like the height it went to.
James, the data clips at the 16 bit limit, so it would throw off the riemann sum of the data. What you could do is try to find the time when the velocity is zero by minizing for x^2+y^2+z^2 between samples where you think the apex is. This sample # will be the apex sample #. Then average sqrt(x^2 + y^2 + z^2) from the apex sample # until some sample before hitting the ground, this should be the average acceleration towards the ground. Then adjust the data to be in m/(s)^2 using 1g = 9.81 m/(s)^2 and 0 ( should be ~2^15.) Calculate the time it took to hit the ground using the sample rate, and the difference between the apex sample # and the huge spike when it hits the ground. then substitute that into h= 1/2 * a * t^2. h = height, a=acceleration, t= time.
Nice project. I specially like the way you use a cheap Nunchuck for accelerometer. I guess another cool thing to add would be a barometric sensor. That way height of the rocket can be determined more accurately. I am heading out to get me a nunchuck controller... :)
Integrating over the z axis isn't enough, Integrating over acceleration gives you speed, Integrating over speed gives you total distance but only using the z axis would be inaccurate since it wouldn't remain nose down (or up) for very long, the best way I can think of to get an accurate result is to combine the accelerations into total acceleration using A_total = sqrt(x^2 + y^2 + x^2) which gives a new signal, Integrate this twice over the samples from launch till it hits the ground and divide by 2 to get to maximum hight.
You forgot your factor of 1/2 in your kinematic equation. h = 0 + 0 + 1/2 * 9.81 m/(s)^2 * (8.5 s)^2 ~~ 354 m (neglecting air resistance.) Also your log file link should point to: http://spritesmods.com/rocketlogger/rocketlaunch.txt Nice site, keep up the good work!
Very cool stuff. What's better than rocket electronics ;) I think the 700 is much too high though. The commercial motors you buy generally don't bring you that high. Assuming that the rocket went nose down, you could calculate the height by integrating the z-acceleration.
Very well done and documented. Glad to see a practical application for this circuit. Cheers!
You can now buy some really nice 10 degree of freedom IMU boards for less than $20. Search Ebay for "10 dof IMU" They connect via IIC and run off of 3-5V. You get 3 axes of acceleration, rotation, magnetic vectors, and air pressure. Most have accelerometers that go to 16g. Some of the pressure sensors are sensitive enough to detect a height change of less than 6 inches.